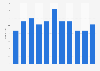
| Characteristic | Index score |
|---|---|
| - | - |
| - | - |
| - | - |
| - | - |
| - | - |
| - | - |
| - | - |
| - | - |
| - | - |
| - | - |
The chart is not accessible to screen readers. Please switch to the table view to access the data.
Download
Source
Source
Release date
October 2017
More information
Region
Canada
Survey time period
May to June 2017
Number of respondents
1,001 respondents
Supplementary notes
The data is based on a study which includes primary and secondary research as well as surveys on more than 1,400 brands, measuring more than 200 global brands.
The total index score is normalized to 100. A number above 100 shows the extent to which the brand scored above the market average.
Citation formats