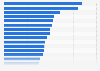
| Characteristic | Less than 25% | 25% to 49% | 50% to 74% | 75% or more | Don't know/prefer not to say |
|---|---|---|---|---|---|
| Feb '17 | 62% | 19% | 6% | 6% | 8% |
| Jan '17 | 60% | 14% | 7% | 5% | 14% |
| Dec '16 | 61% | 13% | 4% | 9% | 14% |
| Nov '16 | 48% | 23% | 6% | 6% | 17% |
| Oct '16 | 57% | 11% | 3% | 14% | 14% |
| Sep '16 | 63% | 13% | 6% | 7% | 13% |
| Aug '16 | 50% | 16% | 7% | 11% | 16% |
| Jul '16 | 55% | 20% | 7% | 9% | 9% |
| Jun '16 | 67% | 18% | 4% | - | 11% |
| May '16 | 53% | 10% | 7% | 5% | 25% |
| Apr '16 | 45% | 24% | 4% | 8% | 18% |
| Mar '16 | 64% | 15% | 7% | 7% | 8% |
| Feb '16 | 44% | 21% | 11% | 8% | 17% |
The chart is not accessible to screen readers. Please switch to the table view to access the data.
Loading statistic...
Download
Source
Sources
Release date
March 2017
More information
Region
United Kingdom
Survey time period
February 2016 to February 2017
Number of respondents
52**
Method of interview
Online survey
Supplementary notes
* Source question: What proportion of your revenue comes from international exports?
** Survey sample group size varies:
Feb '16 = 154
Mar '16 = 120
Apr '16 = 49
May '16 = 60
Jun '16 = 45
Jul '16 = 55
Aug '16 = 56
Sep '16 = 72
Oct '16 = 35
Nov '16 = 69
Dec '16 = 56
Jan '17 = 58
Feb '17 = 52.
Citation formats