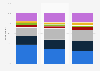
| Characteristic | Share of respondents |
|---|---|
| - | - |
| - | - |
| - | - |
| - | - |
| - | - |
| - | - |
| - | - |
| - | - |
| - | - |
The chart is not accessible to screen readers. Please switch to the table view to access the data.
Download
Source
Source
Release date
December 2024
More information
Region
United States
Survey time period
2024
Number of respondents
1,502 respondents
Special properties
digital travelers (i.e. traveler consumers who use technology for trip planning and execution)鹿
Supplementary notes
鹿 The source mentioned that 39 percent of the sample was aware of and had used generative AI.
Citation formats