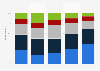
| Characteristic | Paid subscriptions | Free online services | Pay per view / rental | Digital purchase | Unofficial streaming websites | Other |
|---|---|---|---|---|---|---|
| - | - | - | - | - | - | - |
| - | - | - | - | - | - | - |
| - | - | - | - | - | - | - |
The chart is not accessible to screen readers. Please switch to the table view to access the data.
Download
Source
Source
In cooperation with
Simon-Kucher & Partners
Release date
October 2024
More information
Region
Worldwide
Survey time period
2022 to 2024
Number of respondents
12,163*
Method of interview
Online survey
Supplementary notes
*The number of respondents in 2022 was 11,382; in 2023 the number was 11,910.
Original question: 鈥淗ow do you divide the time you spend watching [via streaming] between the following providers?鈥�
Unweighted average of countries tested in all 3 years (Australia, Brazil, China, Germany, Netherlands, Singapore, Spain, Sweden, UK, U.S.).
Citation formats