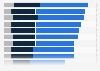
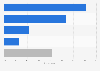
| Characteristic | March 2020 | October to November 2023 | October to November 2024 |
|---|---|---|---|
| - | - | - | - |
| - | - | - | - |
| - | - | - | - |
| - | - | - | - |
| - | - | - | - |
The chart is not accessible to screen readers. Please switch to the table view to access the data.
Download
Source
Source
Release date
January 2025
More information
Region
Worldwide
Survey time period
March 2020, and October to November 2023 and 2024
Number of respondents
4,549*
Age group
18 years and older
Special properties
consumers who paid more for a sustainable product
Supplementary notes
* in 2024. The previous survey in March 2020 counted 4,779 respondents, while the survey from October to November 2023 counted 4,307 respondents.聽
In total, circa 12,000 consumers in 11 countries across North America, Europe, and Asia鈥揚acific were surveyed.
Citation formats