


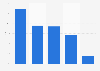

| Characteristic | Cost per tap in U.S. dollars |
|---|---|
| - | - |
| - | - |
| - | - |
| - | - |
| - | - |
| - | - |
| - | - |
The chart is not accessible to screen readers. Please switch to the table view to access the data.
Download
Source
Source
Release date
November 2022
More information
Region
Worldwide
Survey time period
Q1 2021 to Q3 2022
Special properties
based on the analysis of approximately 398 million taps via SearchAds.com, wider industry metrics may vary
Supplementary notes
Cost per tap (CPT) identifies spending divided by taps
Citation formats



