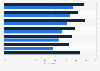
| Characteristic | Single technology | Multiple technologies |
|---|---|---|
| Czechia | 25.87% | 64.78% |
| Belgium | 20.14% | 70.13% |
| Netherlands | 32.67% | 56.95% |
| Denmark | 25.42% | 59.09% |
| Austria | 23.94% | 58.69% |
| Sweden | 26.72% | 54.95% |
| Slovenia | 27.22% | 52.92% |
| Spain | 22.61% | 57.17% |
| Finland | 18.45% | 60.64% |
| Slovakia | 36.35% | 39.95% |
| Germany | 26.46% | 48.47% |
| EU27 | 26.89% | 46.74% |
| Malta | 25.92% | 47.69% |
| Ireland | 27.25% | 46.3% |
| Romania | 38.39% | 33.04% |
| Italy | 28.55% | 42.19% |
| Estonia | 27.16% | 41.27% |
| Portugal | 24.4% | 41.43% |
| Poland | 25.42% | 40.16% |
| Cyprus | 24.78% | 40.53% |
| Croatia | 27.86% | 33.86% |
| Latvia | 25.33% | 35.85% |
| Lithuania | 29.63% | 31.27% |
| France | 29.24% | 31% |
| Bulgaria | 31.34% | 25.49% |
| Luxembourg | 30.17% | 26.62% |
| Hungary | 27.4% | 26.01% |
| Greece | 22.94% | 30.08% |
The chart is not accessible to screen readers. Please switch to the table view to access the data.
Loading statistic...
Download
Source
Source
Release date
October 2024
More information
Region
EU
Survey time period
2024
Supplementary notes
The question was phrased by the source as follows: "To what extent, if at all, are each of the following digital technologies used within your business? Please say if you do not use the technology within your business.".聽
Figures combine used the technology "in parts of business" and "entire business".
The source does not show figures for those that said not an obstacle at all/don't know/refused.
Citation formats