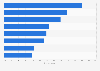
| Characteristic | Sales value in trillion Japanese yen |
|---|---|
| - | - |
| - | - |
| - | - |
| - | - |
| - | - |
| - | - |
| - | - |
The chart is not accessible to screen readers. Please switch to the table view to access the data.
Download
Source
Source
Release date
September 2022
More information
Region
Japan
Survey time period
2020 to 2021
Special properties
market size is based on sales at businesses
Supplementary notes
*Projection.
**Forecast.
Research targets were warranty vendors for consumer products, housing distributors, housing equipment manufacturers, house renovation companies, car dealers, used-car distributors, mobile phone distributors, electronics retail stores, DIY stores (home centers), etc. Insurance services for mobile phones offering replacement in case of insured events are included as extended warranty services.
100 Japanese yen equal 0.76 U.S. dollars or 0.71 euros as of January 2023.
Values have been rounded.
Citation formats