

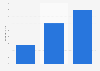


| Characteristic | After COVID-19 outbreak | During COVID-19 outbreak | Before COVID-19 outbreak |
|---|---|---|---|
| Clothes | 55% | 58% | 55% |
| Entertainment goods | 55% | 58% | 52% |
| Toys | 50% | 52% | 45% |
| Appliances | 49% | 51% | 42% |
| Sports equipment | 44% | 49% | 40% |
| Kitchenware | 38% | 40% | 31% |
| Hardware and tools | 38% | 38% | 29% |
| Personal care products | 36% | 36% | 32% |
| Health and wellness products | 31% | 31% | 25% |
| Home care products | 29% | 30% | 21% |
| Beverages | 27% | 28% | 20% |
| Packaged food | 26% | 27% | 20% |
| Medication | 26% | 25% | 18% |
| Fresh food | 24% | 22% | 19% |
The chart is not accessible to screen readers. Please switch to the table view to access the data.
Loading statistic...
Download
Source
Source
Release date
May 2020
More information
Region
Netherlands
Survey time period
2020
Number of respondents
1,026 respondents
Special properties
Dutch consumers
Method of interview
Online survey
Supplementary notes
Survey questions:
1. Before the Coronavirus Disease 2019/Covid-19 outbreak in the Netherlands, how did you usually shop for (product)?
2. How are you currently shopping after the Coronavirus Disease 2019/Covid-19 outbreak for (product)?
3. And how do you plan to shop for (product) after the Coronavirus Disease 2019/Covid-19 outbreak ends in the Netherlands?
Percentages reflect the share of consumers indicating they would by the product online.
Citation formats



