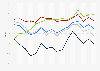
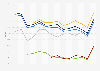
| Characteristic | Total | White | Black | Hispanic | Asian** | White non-Hispanic*** |
|---|---|---|---|---|---|---|
| 2024 | 43.9% | 46% | 39.8% | 30.9% | 33.1% | 52.9% |
| 2020 | 48% | 49.7% | 44.4% | 34.4% | 42.4% | 56% |
| 2016 | 39.4% | 41.1% | 40.2% | 27.2% | 25.2% | 45.8% |
| 2012 | 38% | 37.8% | 45.9% | 26.7% | 20.1% | 41.4% |
| 2008 | 44.3% | 43.8% | 52.3% | 27.4% | 27.8% | 48.3% |
| 2004 | 41.9% | 42.6% | 44% | 20.4% | 23.4% | 48.5% |
| 2000 | 32.3% | 33% | 33.9% | 15.4% | 15.9% | 37.2% |
| 1996 | 32.4% | 33.3% | 32.4% | 15.1% | 19.2% | 36.9% |
| 1992 | 42.8% | 45.4% | 36.6% | 17.6% | - | - |
| 1988 | 36.2% | 37% | 35% | 16.8% | - | - |
| 1984 | 40.8% | 41.6% | 40.6% | 21.9% | - | - |
| 1980 | 39.9% | 41.8% | 30.1% | 15.9% | - | - |
| 1976 | 42.2% | 44.7% | 27.9% | 21.8% | - | - |
| 1972 | 49.6% | 51.9% | 34.7% | 30.9% | - | - |
| 1968 | 50.4% | 52.8% | 38.9% | - | - | - |
| 1964 | 50.9% | 52.1% | 44.2% | - | - | - |
The chart is not accessible to screen readers. Please switch to the table view to access the data.
United States
1964 to 2024
*Voter turnout figures relate to the share of eligible voters who take part in the election, and does not represent the share of the entire population (for example, under-18's, non-citizens, felons (rules vary)).
Residents in U.S. overseas territories are eligible to vote in general elections, but may not vote in the presidential election.
**Prior to 2004, data also includes Pacific Islanders, therefore caution is advised when comparing figures over time.
***Non-Hispanic whites are defined as European Americans, Middle Eastern Americans, and North African Americans, who do not have Hispanic ancestry. Their data is also included in the "White"category.
Data from before 1972 is for 21 to 24 year olds, except for voters in Georgia and Kentucky (18-24), Alaska (19-24) and Hawaii (20-24). The 26th Amendment to the U.S. constitution lowered the minimum voting age to 18 across the country.