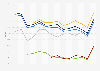
| Characteristic | Total | White | Black | Hispanic | Asian** | White non-Hispanic*** |
|---|---|---|---|---|---|---|
| 2024 | 52.4% | 55.3% | 47.6% | 32% | 35.6% | 63.8% |
| 2020 | 55% | 57.6% | 53.6% | 35.6% | 35% | 65.1% |
| 2016 | 49% | 50.8% | 52.2% | 28.7% | 28.4% | 58.4% |
| 2012 | 49.5% | 49.9% | 58.9% | 27% | 27.1% | 57.2% |
| 2008 | 51.9% | 52.7% | 58.7% | 26.5% | 27.1% | 60.3% |
| 2004 | 52.2% | 54% | 54% | 23% | 23.9% | 61.6% |
| 2000 | 49.8% | 51.2% | 52.1% | 23.2% | 22.2% | 56.3% |
| 1996 | 49.2% | 50.8% | 47.8% | 22.9% | 22.8% | 55.1% |
| 1992 | 58.3% | 60.6% | 52.1% | 26.4% | - | - |
| 1988 | 54% | 55.9% | 48% | 27.1% | - | - |
| 1984 | 58.4% | 60% | 56.2% | 31.1% | - | - |
| 1980 | 58.7% | 60.3% | 51.9% | 30.4% | - | - |
| 1976 | 58.7% | 60.6% | 49.6% | 33.2% | - | - |
| 1972 | 62.7% | 64% | 55.6% | 39.5% | - | - |
| 1968 | 66.6% | 67.7% | 60.3% | - | - | - |
| 1964 | 69% | 70.1% | 61.5% | - | - | - |
The chart is not accessible to screen readers. Please switch to the table view to access the data.
United States
1964 to 2024
*Voter turnout figures relate to the share of eligible voters who take part in the election, and does not represent the share of the entire population (for example, under-18's, non-citizens, felons (rules vary)).
Residents in U.S. overseas territories are eligible to vote in general elections, but may not vote in the presidential election.
**Prior to 2004, data also includes Pacific Islanders, therefore caution is advised when comparing figures over time.
***Non-Hispanic whites are defined as European Americans, Middle Eastern Americans, and North African Americans, who do not have Hispanic ancestry. Their data is also included in the "White"category.