| Characteristic | Total | 18-24** | 25-44 | 45-64 | 65+ |
|---|---|---|---|---|---|
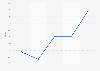
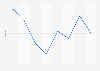
| 2024 | 61% | 47.4% | 54.7% | 64.7% | 71.2% |
| 2020 | 63% | 50.2% | 57.8% | 67% | 71% |
| 2016 | 58.1% | 42.4% | 52.3% | 63.3% | 67.1% |
| 2012 | 58.5% | 41.3% | 56.4% | 68.8% | 68% |
| 2008 | 60.4% | 47.7% | 55.3% | 66.9% | 66.5% |
| 2004*** | 60.1% | 44.9% | 55.4% | 67.9% | 66.7% |
| 2000 | 56.2% | 34.6% | 52.3% | 65.3% | 64.8% |
| 1996 | 55.5% | 35% | 51.5% | 65.1% | 64.1% |
| 1992 | 62.3% | 45.1% | 60.6% | 70.2% | 67% |
| 1988 | 58.3% | 38.2% | 56.1% | 67.7% | 65.6% |
| 1984 | 60.8% | 42.8% | 60.5% | 69.8% | 64.8% |
| 1980 | 59.4% | 41.2% | 60.1% | 68.9% | 61.3% |
| 1976 | 58.8% | 43.4% | 59.5% | 67.9% | 58% |
| 1972 | 62% | 50.4% | 62.9% | 69.6% | 58.4% |
| 1968*** | 66% | 50.6% | 66.1% | 73.3% | 58.5% |
| 1964 | 67% | 50.5% | 68% | 73.5% | 60.4% |
The chart is not accessible to screen readers. Please switch to the table view to access the data.
United States
1964 to 2024
*Voter turnout figures relate to the share of eligible voters who take part in the election, and does not represent the share of the entire population (for example, under-18's, non-citizens, felons (rules vary)).
Residents in U.S. overseas territories are eligible to vote in general elections, but may not vote in the presidential election.
**Data from before 1972 is for 21 to 24 year olds, except for voters in Georgia and Kentucky (18-24), Alaska (19-24) and Hawaii (20-24). The 26th Amendment to the U.S. constitution lowered the minimum voting age to 18 across the country.
***The figure for the 25 to 44 age group in 2004 was mistakenly reported as 44.9 percent in the source (the same number as the 18 to 24 age group). In order to correct this, the percentages from the total population (52.2 percent) and male population (49.0 percent) in this age bracket were used to calculate a figure for female voter turnout in 2004 (55.4 percent). The calculation assumes that the ratio of men to women in the U.S. was exactly 1:1; therefore these values should be seen as indicative and not completely accurate.
The figure for the 65+ age group in 1968 was mistakenly reported as 73.3 percent (the same number as the45-64 age group). In order to correct this, the percentages from the total population (65.8 percent) and male population (73.1 percent) in this age bracket were used to calculate a figure for female voter turnout in 1968 (58.5). The calculation assumes that the ratio of men to women in the U.S. was exactly 1:1; therefore these values should be seen as indicative and not completely accurate.