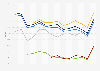
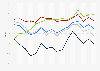
| Characteristic | National average | 18-24** | 25-44 | 45-64 | 65+ |
|---|---|---|---|---|---|
| 2022 | 47.7% | 25.6% | 38.7% | 53.2% | 64.6% |
| 2018 | 49% | 30.1% | 40.4% | 55% | 63.8% |
| 2014 | 38.5% | 15.9% | 28.3% | 46% | 57.5% |
| 2010 | 41.8% | 19.6% | 32.2% | 51.1% | 58.9% |
| 2006 | 43.6% | 19.9% | 34.4% | 54.3% | 60.5% |
| 2002 | 42.3% | 17.2% | 34.1% | 53.1% | 61% |
| 1998 | 41.9% | 16.6% | 34.8% | 53.6% | 59.5% |
| 1994 | 45% | 20.1% | 39.4% | 56.7% | 61.3% |
| 1990 | 45% | 20.4% | 40.7% | 55.8% | 60.3% |
| 1986 | 46% | 21.9% | 41.4% | 58.7% | 60.9% |
| 1982 | 48.5% | 24.8% | 45.4% | 62.2% | 59.9% |
| 1978 | 45.9% | 23.5% | 43.1% | 58.5% | 55.9% |
| 1974 | 44.7% | 23.8% | 42.2% | 56.9% | 51.4% |
| 1970 | 54.6% | 30.4% | 51.9% | 64.2% | 57% |
| 1966 | 55.4% | 31.1% | 53.1% | 64.5% | 56.1% |
The chart is not accessible to screen readers. Please switch to the table view to access the data.
Zoomable Statistic: Select the range in the chart you want to zoom in on.
Loading statistic...
Download
Source
Source
Release date
April 2025
More information
Region
United States
Survey time period
1966 to 2022
Supplementary notes
*Voter turnout figures relate to the share of eligible voters who take part in the election, and does not represent the share of the entire population (for example, under-18's, non-citizens, felons (rules vary)).
Residents in U.S. overseas territories are eligible to vote in general elections, but may not vote in the presidential election.
**Data from before 1972 is for 21 to 24 year olds, except for voters in Georgia and Kentucky (18-24), Alaska (19-24) and Hawaii (20-24). The 26th Amendment to the U.S. constitution lowered the minimum voting age to 18 across the country.
Citation formats