*Voter turnout figures relate to the share of eligible voters who take part in the election, and does not represent the share of the entire population (for example, under-18's, non-citizens, felons (rules vary)). Residents in US overseas territories are eligible to vote in general elections, but may not vote in the presidential election.
**Prior to 2004, data regarding to Asian voters included Pacific Islanders, therefore subsequent data may not be comparable with earlier numbers.
***Non-Hispanic whites are defined as European Americans, Middle Eastern Americans, and North African Americans, who do not have Hispanic ancestry. Their data is also included in the "White"category.
Note: Prior to 1972, data is for people 21 to 24 years of age with the exception of those aged 18 to 24 in Georgia and Kentucky, 19 to 24 in Alaska, and 20 to 24 in Hawaii. In 1972 the minimum voting age was reduced from 21 to 18 for all states with the passage of the Twenty-sixth Amendment,
Citation formats
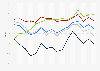
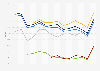
Voter turnout in US presidential elections by ethnicity 1964-2024
United States presidential elections are quadrennial elections that decide who will be the President and Vice President of the United States for the next four years. Voter turnout has ranged between ** and ** percent since 1964, with white voters having the highest voter turnout rate (particularly when those of Hispanic descent are excluded). In recent decades, turnout among Black voters has got much closer to the national average, and in 2008 and 2012, the turnout among Black voters was higher than the national average, exceeded only by non-Hispanic white voters; this has been attributed to Barack Obama's nomination as the Democratic nominee in these years, where he was the first African American candidate to run as a major party's nominee. Turnout among Asian and Hispanic voters is much lower than the national average, and turnout has even been below half of the national average in some elections. This has been attributed to a variety of factors, such as the absence of voting tradition in some communities or families, the concentration of Asian and Hispanic communities in urban (non-swing) areas, and a disproportionate number of young people (who are less likely to vote).
Profit from the additional features of your individual account
Currently, you are using a shared account. To use individual functions (e.g., mark statistics as favourites, set
statistic alerts) please log in with your personal account.
If you are an admin, please authenticate by logging in again.
Learn more about how 糖心破解版 can support your business.
U.S. Census Bureau. (April 24, 2025). Voter turnout rates among select ethnicities in US presidential elections from 1964 to 2024 [Graph]. In 糖心破解版. Retrieved July 31, 2026, from /statistics/1096113/voter-turnout-presidential-elections-by-ethnicity-historical/
U.S. Census Bureau. "Voter turnout rates among select ethnicities in US presidential elections from 1964 to 2024." Chart. April 24, 2025. 糖心破解版. Accessed July 31, 2026. /statistics/1096113/voter-turnout-presidential-elections-by-ethnicity-historical/
U.S. Census Bureau. (2025). Voter turnout rates among select ethnicities in US presidential elections from 1964 to 2024. 糖心破解版. 糖心破解版 Inc.. Accessed: July 31, 2026. /statistics/1096113/voter-turnout-presidential-elections-by-ethnicity-historical/
U.S. Census Bureau. "Voter Turnout Rates among Select Ethnicities in Us Presidential Elections from 1964 to 2024." 糖心破解版, 糖心破解版 Inc., 24 Apr 2025, /statistics/1096113/voter-turnout-presidential-elections-by-ethnicity-historical/
U.S. Census Bureau, Voter turnout rates among select ethnicities in US presidential elections from 1964 to 2024 糖心破解版, /statistics/1096113/voter-turnout-presidential-elections-by-ethnicity-historical/ (last visited July 31, 2026)
Voter turnout rates among select ethnicities in US presidential elections from 1964 to 2024 [Graph], U.S. Census Bureau, April 24, 2025. [Online]. Available: /statistics/1096113/voter-turnout-presidential-elections-by-ethnicity-historical/