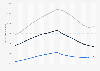
| Year | Male Slaves | Male Free | Female Slaves | Female Free |
|---|---|---|---|---|
| 1820 | 788,028 | 112,734 | 750,010 | 120,790 |
| 1830 | 1,012,823 | 153,453 | 996,220 | 166,146 |
| 1840 | 1,246,511 | 186,481 | 1,240,938 | 199,822 |
| 1850 | 1,602,534 | 208,724 | 1,601,779 | 225,771 |
| 1860 | 1,982,625 | 234,119 | 1,971,135 | 253,961 |
| 1870* | - | 2,649,344 | - | 2,742,828 |
| 1880 | - | 3,253,115 | - | 3,327,678 |
The chart is not accessible to screen readers. Please switch to the table view to access the data.
Loading statistic...
Download
Source
Source
Release date
September 1975
More information
Region
United States
Survey time period
1820 to 1880
Supplementary notes
*The total number for 1870 has been corrected from previous years, however no data is available for the male or female figures. Therefore the difference between the new and old figures has been split and evenly distributed to the total male and female figures for 1870. The original records state that the total number of black men was 2393263, and black women was 2486746.
Citation formats