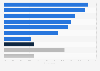
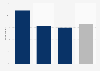
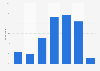
| Characteristic | Share of respondents |
|---|---|
| - | - |
| - | - |
| - | - |
| - | - |
The chart is not accessible to screen readers. Please switch to the table view to access the data.
Download
Source
More information
Region
United States
Survey time period
October 2018
Number of respondents
2,071 respondents
Supplementary notes
The question was phrased by the source as follows: "This holiday season, how likely are you to shop with: socially/environmentally responsible brands/retailers, retailers that offer handmade/artisanal products, second-hand retailers, retailers who focus on health/wellness?"
Citation formats