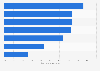
| Characteristic | Show products/services | Provide information (e.g. opening hours, contact info) | Advertise to potential new customers | Communicate with customers or suppliers | Sell products/services | Manage internal business processes (e.g. finances, communication among employees) | Accepting or making payments | Other |
|---|---|---|---|---|---|---|---|---|
| Jan '18 | 78% | 80% | 82% | 63% | 45% | 22% | 33% | 2% |
| Dec '17 | 77% | 78% | 82% | 58% | 43% | 17% | 25% | 2% |
| Nov '17 | 79% | 77% | 80% | 63% | 46% | 25% | 31% | 2% |
| Oct '17 | 78% | 77% | 82% | 67% | 43% | 20% | 33% | 3% |
| Sep '17 | 82% | 79% | 83% | 63% | 47% | 20% | 31% | 2% |
| Aug '17 | 78% | 81% | 84% | 62% | 42% | 22% | 29% | 2% |
| Jul '17 | 78% | 79% | 83% | 65% | 42% | 20% | 31% | 1% |
| Jun '17 | 81% | 79% | 81% | 58% | 41% | 21% | 34% | 2% |
| May '17 | 78% | 78% | 85% | 63% | 44% | 21% | - | 4% |
| Apr '17 | 79% | 76% | 83% | 61% | 47% | 20% | - | 3% |
| Mar '17 | 78% | 83% | 86% | 58% | 40% | 21% | - | 4% |
| Feb '17 | 74% | 75% | 81% | 58% | 40% | 16% | - | 3% |
| Jan '17 | 82% | 81% | 84% | 61% | 43% | 16% | - | 3% |
| Dec '16 | 78% | 77% | 81% | 57% | 39% | 18% | - | 1% |
| Nov '16 | 81% | 81% | 82% | 58% | 44% | 18% | - | 2% |
| Oct '16 | 78% | 79% | 83% | 57% | 39% | 18% | - | 1% |
The chart is not accessible to screen readers. Please switch to the table view to access the data.
Loading statistic...
Download
Source
Sources
Release date
March 2017
More information
Region
Germany
Survey time period
October 2016 to January 2018
Number of respondents
Various*
Method of interview
Online survey
Supplementary notes
* Source question: For which of the following do you use online tools or platforms (e.g. websites/apps, social networks like Facebook or Google+, etc.)?
** Survey sample group size varies:
Oct '16 = 498
Nov '16 = 530
Dec '16 = 422
Jan '17 = 538
Feb '17 = 416.
Citation formats