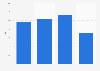
| Characteristic | Inbox placement rate | Spam rate | Missing rate |
|---|---|---|---|
| - | - | - | - |
| - | - | - | - |
| - | - | - | - |
| - | - | - | - |
| - | - | - | - |
| - | - | - | - |
| - | - | - | - |
| - | - | - | - |
| - | - | - | - |
| - | - | - | - |
| - | - | - | - |
| - | - | - | - |
| - | - | - | - |
The chart is not accessible to screen readers. Please switch to the table view to access the data.
Download
Source
Sources
Release date
August 2018
More information
Region
United States
Survey time period
Q2 2015 to Q2 2018
Supplementary notes
The source provides the following information: "Information captured from high volumes of monitored email accounts (seeds) controlled by senders to sample mailbox providers鈥� placement decisions irrespective of user-initiated or engagement-based filtering. For new programs with little or no history of subscriber interaction, seeds can provide an accurate assessment of inbox placement."
Citation formats