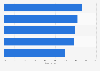
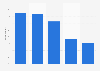
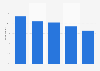
| Characteristic | Share of global sales |
|---|---|
| - | - |
| - | - |
| - | - |
| - | - |
The chart is not accessible to screen readers. Please switch to the table view to access the data.
October 2015
Worldwide
2014
1,319 brands
The source provides the following explanations:
Claim only: a brand directly indicates a connection to sustainability on a product鈥檚 label or packaging.
Marketing only: a brand uses web sites, news coverage, and other messaging vehicles to promote positive social and/or environmental impact in the local or global community.
Claim and marketing: a brand uses a product claim and also integrates sustainability into its marketing promotion.
The source provides the following information about the methodology: "The findings from the retail sales information included in this report are collected from stores using electronic point-of-sale technology and/or teams of local field auditors. The data represents a cross-section of 1,319 brands among 13 categories (both consumable and non-consumable categories) across and average of 13 countries* for the 12-month period ending December 2014. On average, the brands measured in this study represent 73% of 2014 value sales (USD) in each country-category analyzed (private label brands were not included). Stores within Nielsen鈥檚 worldwide retail network include grocery, convenience and discount retailers, who, through various cooperation arrangements, share their sales data with Nielsen."