


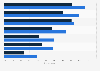

| Characteristic | 2012 | 2013 | 2014 | 2015 | 2016 | 2017 | 2018 | 2019 |
|---|---|---|---|---|---|---|---|---|
| Information about goods and services | 76.3% | 76.5% | 79.8% | 79% | 78.6% | 83.3% | 83.7% | 84.2% |
| Playing or downloading music or games | 53.5% | 57.6% | 58.3% | 57.2% | 57.5% | 64.6% | 62% | 72.3% |
| Reading or downloading newspapers or news magazines | 50% | 50.1% | 51.8% | 50.3% | 63.8% | 70.1% | 65.9% | 70% |
| Information about health | 49.2% | 51.8% | 56% | 56.7% | 57.9% | 66.4% | 67.1% | 69% |
| Watching television | 39% | 42.4% | 45.8% | 45.2% | 44.5% | 60% | 55.9% | 63.3% |
| Uploading pictures, music, tekst, etc | 44.8% | - | 47.2% | 45.4% | 43.1% | 48.9% | 43.1% | 50% |
| Searching for a job or job application | 17.3% | 18.2% | 23.1% | 21.2% | 21% | 22.3% | 22.2% | 22.5% |
| Listening to the radio | 34.5% | 35.5% | 34.8% | 34.2% | 34.9% | 42.7% | - | - |
| Usage of travel agency services | 45.7% | 44.7% | 45.6% | 44.5% | 45.4% | 50.7% | - | - |
| Downloading software (other than games) | 28.6% | 32.1% | 30% | 26.2% | 24.9% | 29.7% | - | - |
Download
Source
Source
Release date
October 2019
More information
Region
Netherlands
Survey time period
2012 to 2019
Number of respondents
4,500 respondents
Age group
12 years and older
Special properties
individuals who are part of a private household; internet for private usage
Method of interview
Computer-assisted telephone interviews (CATI)
Supplementary notes
This question was phrased by the source as follows: "Did you use the internet in the past three months for one of the following activities: to find information about goods or services; to use services in the travel branch; to look for a job or apply for a job; to find information concerning health; to listen to the radio; to watch television; to read or download newspapers or news magazines; to play or download games, images, movies or music; to upload self made pictures, music, videos, text or software; to download software other than games?"
Multiple answers were possible.
Citation formats



