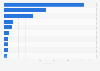
| Characteristic | Dec 2014 | Dec 2016 | Dec 2017 | Dec 2018 | Dec 2019 | Jun 2020 |
|---|---|---|---|---|---|---|
| 76% | 84% | 83% | 88% | 87% | 87% | |
| YouTube | 66% | 80% | 83% | 86% | 86% | 86% |
| Bol.com | 49% | 58% | 61% | 79% | 81% | 79% |
| WhatsApp Messenger | 50% | 65% | 0% | 75% | 79% | 77% |
| Facebook Messenger | 40% | 57% | 0% | 62% | 53% | 68% |
| 20% | 36% | 38% | 50% | 57% | 61% | |
| Marktplaats | 48% | 56% | - | 58% | - | 58% |
| NOS | 36% | 50% | 47% | 50% | 52% | 52% |
| AD (Algemeen Daglad) | 33% | 40% | 41% | 50% | 55% | 51% |
| NU.nl | 46% | 51% | 49% | 54% | 51% | 51% |
| 34% | 38% | 34% | 48% | 50% | 44% | |
| 29% | 35% | 37% | 44% | 41% | 42% | |
| Spotify | 16% | 28% | - | 41% | - | 41% |
| AliExpress | 8% | 21% | 29% | 35% | 38% | 39% |
| 16% | 32% | 32% | 41% | 40% | 39% | |
| Telegraaf | 33% | 37% | 35% | 46% | 44% | 38% |
| Netflix | 10% | 24% | 29% | 36% | 38% | 36% |
| Amazon | - | - | 16% | - | 27% | 36% |
| Mediamarkt | 17% | 26% | - | 31% | - | 27% |
| NPO Start | - | - | 26% | - | 33% | 26% |
| Coolblue | - | - | 13% | - | 29% | - |
| Snapchat | 5% | 11% | 15% | 17% | 18% | - |
| ZIggo GO/TV | - | - | 23% | - | 30% | - |
| KIJK.nl | - | - | 6% | - | 13% | - |
| Videoland | - | - | 5% | - | 11% | - |
| Disney+ | - | - | 0% | - | 18% | - |
Download
Source
Source
Release date
July 2020
More information
Region
Netherlands
Survey time period
June 2020
Age group
13 years and older
Special properties
Selection of commercial brands; Net reach of all platforms
Supplementary notes
The source states that the numbers provided includes all platforms (i.e. desktop, smartphones and tablets. The monthly reach is based on "minimum one site visit or app use in the specific period".
The figures have been taken from several publications.
Citation formats