

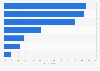


| Characteristic | Share of online shoppers |
|---|---|
| Clothes, sports goods | 73% |
| Tickets for events | 53% |
| Fastfood/pre-cooked food from restaurants, caterings etc. | 52% |
| Booked accommodation through a hotel or travel agency | 41% |
| Transport services through a company | 40% |
| Household goods (e.g. furniture, toys, etc) | 36% |
| Medicine | 35% |
| Telecommunication services | 30% |
| Computer hardware | 24% |
| Video games software | 22% |
| Food or groceries | 22% |
| Books, magazines, newspapers or e-learning material | 20% |
| Other computer software | 18% |
| Music, movies (DVD, CD) | 7% |
| Other | 45% |
The chart is not accessible to screen readers. Please switch to the table view to access the data.
Loading statistic...
Download
Source
Source
Release date
June 2025
More information
Region
Denmark
Survey time period
2024
Age group
16-74 years
Special properties
internet purchases within last year
Supplementary notes
The date of release is the one of last access.
Citation formats



