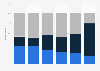
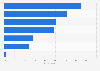
| Characteristic | Very important | Somewhat important | Not at all important | Don't know |
|---|---|---|---|---|
| Getting good value | 87% | 12% | 1% | - |
| That the product is of the best quality | 70% | 26% | 3% | 1% |
| That the product is necessary for my day to day life | 68% | 28% | 3% | 1% |
| Paying the lowest price | 68% | 26% | 5% | 1% |
| That there is a good return policy | 61% | 31% | 7% | 1% |
| That it is a product you have known for a long time | 44% | 44% | 12% | 1% |
| That there is no cheaper alternative for the product | 43% | 42% | 12% | 3% |
| That the product is environmentally friendly | 42% | 44% | 14% | 1% |
| That the product or store is Canadian | 40% | 40% | 20% | 1% |
| That company or store is involved in local community initiative | 27% | 46% | 25% | 3% |
The chart is not accessible to screen readers. Please switch to the table view to access the data.
Loading statistic...
Download
Source
Source
Release date
May 2013
More information
Region
Canada
Survey time period
March 19 to 28, 2013
Number of respondents
1,500 respondents
Method of interview
Online survey
Supplementary notes
The source does not provide any information regarding percentage points exceeding 100 percent.
Citation formats