| Characteristic | Share of respondents |
|---|---|
| - | - |
| - | - |
| - | - |
| - | - |
| - | - |
| - | - |
| - | - |
| - | - |
The chart is not accessible to screen readers. Please switch to the table view to access the data.
Download
Source
Source
Release date
March 2013
More information
Region
Canada
Survey time period
March 2013
Number of respondents
1,500 respondents
Supplementary notes
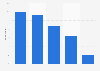
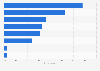
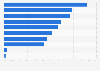
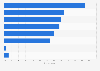
Question: 鈥淲e are now going to present you with three pairs of advertising objectives.
Which advertising objective makes you more likely to pay attention to an
advertisement? The advertisement:鈥�
All objectives were paired together in all possible ways, and three pairings were presented to each respondent in a random way. All pairings were presented in equal frequency to respondents overall.
Citation formats