| Characteristic | Share of respondents |
|---|---|
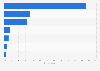
| Attractive deals/promotions/sales | 50% |
| Interested in new product offerings | 33% |
| Received a promotion via email or text/SMS message | 27% |
| To research products on social media before I buy them | 21% |
| Because I shop with them | 20% |
| Friend's or expert's recommendation | 19% |
| Advertising (e.g. TV, outdoor, newspaper/magazine, website) | 16% |
| Opportunity to participate in competitions through social media | 15% |
| Had a good or bad experience and wanted to provide feedback through social media | 12% |
| Flyer or recommendation in-store | 12% |
| The brand provides customer service through social media | 12% |
| To learn about and provide feedback on a brand's social/environmental commitment | 11% |
| The opportunity to influence product design | 9% |
| Brand contacted me through social media | 9% |
| Interested in interacting with the brand and its online followers | 9% |
The chart is not accessible to screen readers. Please switch to the table view to access the data.
Loading statistic...
Download
Source
Sources
Release date
March 2015
More information
Region
Worldwide
Survey time period
2014
Number of respondents
937 respondents
Method of interview
Online survey
Supplementary notes
Respondents had to rank their three most important factors.
Citation formats