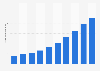
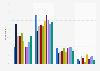
| Characteristic | Share of respondents |
|---|---|
| - | - |
| - | - |
| - | - |
| - | - |
| - | - |
| - | - |
The chart is not accessible to screen readers. Please switch to the table view to access the data.
August 2014
United States
April 28, 2014 to May 29, 2014
500 respondents
Mid-market companies with annual revenues ranging from $100 million to more than $1 billion
Half of the respondents were C-suite executives, while the remaining 50 percent held other management roles.
One third of the respondents were from consumer and industrial product companies, with the remainder divided among energy and resources; financial services; life sciences and health care; technology, media and communications; and other industries.
Some percentages in the charts may not add to 100 percent due to rounding, or for questions where survey participants had the option to choose multiple responses.
The source does not provide further information on the survey methodology (type of survey used).