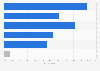
| Channel | Not shopping this way | Less than last year | The same amount | More than last year |
|---|---|---|---|---|
| - | - | - | - | - |
| - | - | - | - | - |
| - | - | - | - | - |
| - | - | - | - | - |
| - | - | - | - | - |
Download
Source
Source
Release date
October 2012
More information
Region
United States
Survey time period
September 18 to 24, 2012
Number of respondents
n = 533
Age group
18 years and older
Method of interview
Online survey
Supplementary notes
Tablet and/or smartphone owners who planned to shop online this holiday season with a household income of $20K+.
Citation formats