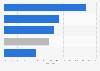
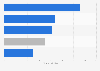
| Type of advertising | 2009 | 2010 | 2011 |
|---|---|---|---|
| - | - | - | - |
| - | - | - | - |
| - | - | - | - |
| - | - | - | - |
| - | - | - | - |
| - | - | - | - |
| - | - | - | - |
| - | - | - | - |
| - | - | - | - |
| - | - | - | - |
| - | - | - | - |
| - | - | - | - |
| - | - | - | - |
| - | - | - | - |
| - | - | - | - |
| - | - | - | - |
Download
Source
Source
Release date
October 2012
More information
Region
United States
Survey time period
June and July 2009, 2010, 2011
Number of respondents
n = 2,454 parents aged 21 to 65 of children aged 2 to 17 living at home**
Method of interview
Online panel
Supplementary notes
* Ratings on the scale from 1 to 10, when 1=no impact, 10=very strong impact.
** Number of respondents:
2009: n = 859,
2010: n = 797,
2011: n = 798.
Citation formats