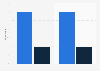
| Characteristic | Increase spending | No change to spending or behavior | No change in spending, behavior changes | Reduce spending |
|---|---|---|---|---|
| - | - | - | - | - |
| - | - | - | - | - |
| - | - | - | - | - |
| - | - | - | - | - |
| - | - | - | - | - |
| - | - | - | - | - |
| - | - | - | - | - |
| - | - | - | - | - |
| - | - | - | - | - |
| - | - | - | - | - |
| - | - | - | - | - |
| - | - | - | - | - |
| - | - | - | - | - |
| - | - | - | - | - |
| - | - | - | - | - |
| - | - | - | - | - |
The chart is not accessible to screen readers. Please switch to the table view to access the data.
Download
Source
Source
In cooperation with
McKinsey & Company
Release date
May 2025
More information
Region
China
Survey time period
end of 2024
Number of respondents
17,114 respondents
Age group
18-65 years
Supplementary notes
Original question: "In the next 12 months, how do you expect your household's spending in the following categories to change?"
Percentages may not total 100 due to rounding.
Citation formats