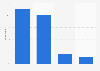
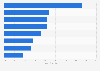
| Characteristic | Grocery spending index |
|---|---|
| - | - |
| - | - |
| - | - |
| - | - |
| - | - |
| - | - |
| - | - |
| - | - |
| - | - |
| - | - |
| - | - |
| - | - |
| - | - |
The chart is not accessible to screen readers. Please switch to the table view to access the data.
Download
Source
Source
Release date
June 2015
More information
Region
United States
Survey time period
52 weeks ending February 7, 2015
Supplementary notes
* Nielsen Homescan Total U.S. 52 weeks ending February 7, 2015. The Homescan national panel consists of a randomly dispersed sample of households that is intended to be representative of, and projectable to the total U.S. market. Panel members use handheld scanners to record items with a UPC code that they purchase from any outlet.
Citation formats