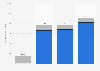
| Characteristic | Share of population |
|---|---|
| Transport services from enterprises | 38.31% |
| Tickets to cultural or other events | 32.72% |
| Rented accommodation services from enterprises (e.g., hotels, travel agencies) | 18.27% |
| Computer or other software, including upgrades | 17.48% |
| Music as a streaming service or downloads | 17.09% |
| Films, series, and concerts as a streaming service or downloads | 16.92% |
| Games online or as downloads for smartphones or computers | 11.98% |
| Subscriptions to the internet or mobile connection services | 11.39% |
| Subcription to electricity, water or heating supply, waste disposal or similar services | 11.27% |
| E-books, online magazines, or online newspapers | 9.41% |
| Tickets to sports events | 7.46% |
| Rented accommodation services from private persons | 7.12% |
| Other apps (e.g., related to language learning, traveling) | 5.54% |
| Apps related to health or fitness | 5.15% |
| Household services (e.g., cleaning, repair work) | 2.73% |
| Transport services from private persons | 0.95% |
The chart is not accessible to screen readers. Please switch to the table view to access the data.
Loading statistic...
Download
Source
Source
Release date
June 2024
More information
Region
Estonia
Survey time period
2023
Citation formats