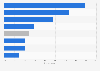
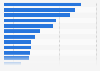
| Characteristic | Original TV programs | Other originals | Recent movies | Current season of network TV | Prior seasons of network TV series | Older movies | Live sports | Other |
|---|---|---|---|---|---|---|---|---|
| - | - | - | - | - | - | - | - | - |
| - | - | - | - | - | - | - | - | - |
| - | - | - | - | - | - | - | - | - |
| - | - | - | - | - | - | - | - | - |
| - | - | - | - | - | - | - | - | - |
| - | - | - | - | - | - | - | - | - |
| - | - | - | - | - | - | - | - | - |
| - | - | - | - | - | - | - | - | - |
The chart is not accessible to screen readers. Please switch to the table view to access the data.
Download
Source
Source
Release date
December 2024
More information
Region
United States
Survey time period
Q3 2024
Number of respondents
1,371 Netflix users, 944 Hulu users, 1,296 Prime Video, 591 Max users, 745 Disney+ users, 385 Peacock Premium users, 666 Paramount+ users, 329 Apple TV+ users
Method of interview
Online survey
Supplementary notes
Original question: 鈥淥f the content you view on (service) which would you say is the content you most enjoy viewing?鈥�
Citation formats