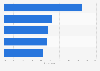
| Characteristic | Share of respondents |
|---|---|
| If there are/will be more discounts | 36% |
| If the prices are more affordable/cheaper | 18% |
| If there are more promotions | 15% |
| If they offer coupons/discount coupons | 7% |
| If they don't charge for shipping/delivery | 5% |
| If they need something urgently | 3% |
| If they are very busy/have no time to go to the store | 3% |
| When they do not want to go out | 3% |
| If online grocery stores sell vegetables and fruits | 3% |
The chart is not accessible to screen readers. Please switch to the table view to access the data.
Loading statistic...
Download
Source
Source
Release date
August 2022
More information
Region
Turkey
Survey time period
May 2022
Number of respondents
805 respondents
Age group
15-55 years old
Special properties
Participants from 81 different cities who did online grocery shopping in the last three days
Method of interview
Online panel
Supplementary notes
34% of the survey participants did online grocery shopping on the day of the survey and 66% of them did online grocery shopping until 2 days before the survey was conducted. Grocery shopping includes grocery items such as food, beverages, personal care, and cleaning. Non-FMCG products such as clothing, home living products, household appliances are excluded.
Citation formats