

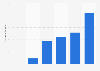
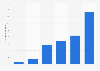

| Characteristic | Optimism index* |
|---|---|
| - | - |
| - | - |
| - | - |
| - | - |
| - | - |
| - | - |
| - | - |
| - | - |
| - | - |
| - | - |
| - | - |
| - | - |
| - | - |
| - | - |
| - | - |
| - | - |
| - | - |
| - | - |
| - | - |
| - | - |
| - | - |
The chart is not accessible to screen readers. Please switch to the table view to access the data.
Download
Source
Source
Release date
April 2022
More information
Region
Czechia
Survey time period
2011 to 2022
Supplementary notes
*Optimism index is calculated as a difference between positive and negative answers to a question: "How do you expect the company's turnover to develop in the next 12 months?"
Citation formats



