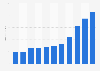
| Characteristic | Buy with the same frequency as before | Stopped buying over the past 6 months, but was buying there before | Started buying over the past 6 months (was not buying there before) | Never bought there |
|---|---|---|---|---|
| Supermarkets | 65% | 21% | 6% | 7% |
| Cosmetics chain stores | 61% | 31% | 3% | 5% |
| Online stores | 55% | 13% | 13% | 19% |
| Pharmacies | 40% | 28% | 9% | 23% |
| Monobrand stores | 39% | 28% | 6% | 28% |
| Official brand sites | 21% | 16% | 6% | 56% |
The chart is not accessible to screen readers. Please switch to the table view to access the data.
Loading statistic...
Download
Source
Source
Release date
June 2021
More information
Region
Russia
Survey time period
April 2021
Number of respondents
300 respondents
Age group
18-40 years
Special properties
Female cosmetic users in cities with 500+ inhabitants
Method of interview
Online panel
Supplementary notes
The source does not provide additional information regarding the percentage points missing or exceeding 100 percent. It might be due to rounding.
Citation formats