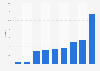


| Characteristic | Year-on-year percentage change in online orders |
|---|---|
| - | - |
| - | - |
| - | - |
| - | - |
| - | - |
| - | - |
| - | - |
| - | - |
| - | - |
| - | - |
| - | - |
| - | - |
| - | - |
| - | - |
| - | - |
| - | - |
| - | - |
| - | - |
| - | - |
| - | - |
| - | - |
| - | - |
| - | - |
| - | - |
| - | - |
| - | - |
The chart is not accessible to screen readers. Please switch to the table view to access the data.
Download
Source
Sources
Release date
July 2020
More information
Region
United Kingdom
Survey time period
January 5, 2020 to Jun 28, 2020
Supplementary notes
Online retail refers to "digital sales across website, mobile, web, and app, of brands who mainly trade in physical stores."
The source identifies the "sport and hobbies" sub-sector as follows: Sport, motor, collectables, outdoor, electronics, hobbies.
Date of release is data of access.
The source adds the following note regarding methodology: "The data included in this visualization is an anonymized subset of the online sales of brands in more than 100 countries, based on consumer engagement across more than one billion consumer profiles and 2,500 global brands."
Date of release is data of access.
Citation formats