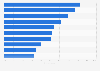
| Characteristic | Adoption rate |
|---|---|
| - | - |
| - | - |
| - | - |
| - | - |
| - | - |
| - | - |
| - | - |
| - | - |
| - | - |
| - | - |
| - | - |
The chart is not accessible to screen readers. Please switch to the table view to access the data.
September 2019
Belgium, France, Germany, Ireland, Italy, Luxembourg, Netherlands, Russia, Spain, Sweden, Switzerland, United Kingdom
From February 4, 2019 to March 11, 2019
27,103 digitally active adults
27 markets worldwide
Online survey
The source defines adoption rate as: "Percentage of digitally active people who used at least two fintech services in the last six months. The figures show FinTech adopters as a percentage of the digitally active population in each market.
All averages are shown on an unweighted basis.
"
FinTech includes money transfer and payments, budgeting and financial planning, savings and investments, borrowing and insurance.