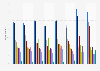
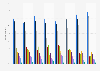
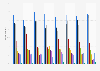
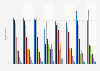
| Characteristic | 2015 | 2017 | 2019 |
|---|---|---|---|
| - | - | - | - |
| - | - | - | - |
| - | - | - | - |
| - | - | - | - |
| - | - | - | - |
The chart is not accessible to screen readers. Please switch to the table view to access the data.
Download
Source
Source
Release date
September 2019
More information
Region
Worldwide
Survey time period
February 4 to March 11, 2019
Number of respondents
27,103 digitally active adults
Special properties
27 markets worldwide
Method of interview
Online survey
Supplementary notes
The source defines adoption rate as: "The figures show the average percentage of respondents who reported using one or more FinTech services
in that category. Data for 2015 differs from that originally published in order to align to the 2017 categorization and averaging methodology."
FinTtch includes money transfer and payments, budgeting and financial planning, savings and investments, borrowing and insurance.
Citation formats