
Matej Mikulic
Research expert covering health, pharma & medtech
The United States is the single largest national pharmaceutical market in the world, accounting for over half of global prescription drug sales by value. Net medicine spending reached approximately 487 billion U.S. dollars in 2024 and is forecast to surpass 600 billion dollars by the end of the decade. Revenue is concentrated in specialty and chronic-care therapy areas 鈥� led by oncology, followed by immunology and anti-diabetes 鈥� with the GLP-1 class emerging as a major commercial force: Mounjaro and Ozempic now rank among the top five drugs by U.S. revenue. This scale is sustained by heavy R&D reinvestment 鈥� roughly one-fifth of global revenues 鈥� and a pipeline that continues to deliver, with novel drug approvals remaining robust and orphan designations elevated, reflecting sustained activity across rare diseases and specialty medicine.
Per capita drug expenditure in the U.S. runs far above the comparable high-income country average, financed through a mix of private insurance, Medicare, Medicaid, and out-of-pocket payments 鈥� with Medicare's share more than tripling over the period shown. Generics and biosimilars now deliver hundreds of billions in annual savings, yet branded products continue to capture a growing share of total spending, while Medicare-negotiated price reductions on major drugs are beginning to reshape the pricing landscape.
Market revenue growth is forecast to ease gradually through the end of the decade, but company-level trajectories diverge sharply. Eli Lilly 鈥� propelled by its GLP-1 franchise 鈥� leads with a forecast five-year growth rate above 14 percent, far ahead of peers such as Amgen and Merck. Major patent expirations 鈥� Keytruda, Eliquis, and Stelara together represent over 70 billion U.S. dollars in peak annual sales 鈥� will determine which companies successfully reload their portfolios.
The U.S. will remain the world's most consequential pharmaceutical profit pool, but value creation is being reshaped by three converging pressures.
First, a patent cliff: between 2025 and 2028, blockbusters targeting complex biologics face loss of exclusivity. Unlike the small-molecule cliffs of the early 2010s, biosimilar erosion will unfold more slowly but with deeper structural consequences for originator margins.聽Second, policy-driven price compression on two fronts. The IRA's Medicare negotiation provisions are estimated to save around 320 billion U.S. dollars through 2031, while the administration's Most-Favored-Nation executive order is pushing manufacturers to align U.S. prices with the lowest offered to comparable nations 鈥� with major companies already signing binding agreements and the TrumpRx platform extending price concessions directly to patients. Third, trade policy uncertainty. Tariffs of up to 100 percent on imported branded drugs and sharply higher levies on Chinese-sourced APIs could raise input costs at the very moment margins are already under pressure.
Taken together, these forces compress the industry from both the revenue and cost sides simultaneously 鈥� a configuration the sector has not faced before. Companies with differentiated pipelines, scaled metabolic franchises, and domestic manufacturing optionality are best positioned to navigate this triple squeeze. Those still dependent on mature blockbusters approaching patent expiry face the most acute strategic risk.

Detailed statistics
U.S. net medicine spending 2015-2030

Detailed statistics
Pharmaceutical preparation manufacturing gross output 1998-2016

Detailed statistics
U.S. pharmaceutical industry spending on research and development 1990-2024

World pharmaceutical market distribution by submarket 2014-2025
Distribution of the total global pharmaceutical market sales from 2014 to 2025, by submarket
U.S. net medicine spending 2015-2030
Net spending on medicines in the U.S. from 2015 to 2030 (in billion U.S. dollars)

Market share of the leading global pharmaceutical markets 2024
Market share of leading 10 national pharmaceutical markets worldwide in 2024

Top global pharmaceutical markets: growth rate 2024
Growth rate of top 10 national pharmaceutical markets worldwide in 2024

U.S. biopharmaceutical export volume 2002-2025
U.S. biopharmaceutical goods export volume from 2002 to 2025 (in billion U.S. dollars)

Leading U.S. biotech and pharmaceutical companies 2026, by revenue
Leading U.S. biotech and pharmaceutical companies as of March 2026, by revenue (in billion U.S. dollars)

Johnson & Johnson revenue 2005-2025
Revenue of Johnson & Johnson from 2005 to 2025 (in million U.S. dollars)

Eli Lilly's total revenue 2007-2025
Revenue of Eli Lilly and Company from 2007 to 2025 (in million U.S. dollars)

Merck & Co. revenue 2006-2025
Revenue of Merck & Co. from 2006 to 2025 (in million U.S. dollars)

Pfizer revenue 2006-2025
Revenue of Pfizer from 2006 to 2025 (in million U.S. dollars)

AbbVie revenue 2010-2025
Revenue of AbbVie from 2010 to 2025 (in million U.S. dollars)

Leading therapy areas by pharma revenue in the U.S. 2025
Leading U.S. therapy areas based on pharmaceutical revenue in 2025 (in billion U.S. dollars)

Top pharma products by prescriptions U.S. 2023
Leading 30 U.S. pharma products by total prescriptions in 2023

U.S. leading prescribed drugs based on sales 2025
Leading 10 prescription drugs based on U.S. sales in 2025 (in billion U.S. dollars)

Pharmaceutical corporations by U.S. revenue 2025
Leading 10 pharmaceutical companies by U.S. revenue in 2025 (in billion U.S. dollars)

OTC total sales volume in the U.S. 2017-2025
Total OTC sales volume in the United States from 2017 to 2025 (in million units)

OTC pharmaceutical market revenue 2026, by segment
OTC pharmaceutical market revenue 2026, by segment (in billion U.S. dollars)

Research and development expenditure: U.S. pharmaceutical industry 1995-2024
Research and development expenditure of total U.S. pharmaceutical industry from 1995 to 2024 (in billion U.S. dollars)

U.S. pharma industry R&D spending as a percent of total revenue 1990-2024
Spending of U.S. pharmaceutical industry for research and development as a percentage of total revenues from 1990 to 2024
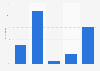
Research & development spending on drug development in the U.S. 2024
Distribution of research and development spending among U.S. companies in 2024

Pharmaceuticals: cost of drug development in the U.S. since 1975
Cost of developing a drug in the U.S. from the 1970s until today (in million U.S. dollars)

Number of novel drugs approved annually by CDER 2008-2025
Total number of novel drugs approved by CDER from 2008 to 2025

Number of orphan designations accepted in the U.S. 2003-2025
Annual number of accepted orphan designations in the United States from 2003 to 2025

Prescription drug expenditure in the U.S. 1960-2024
Prescription drug expenditure in the United States from 1960 to 2024 (in billion U.S. dollars)

Prescription drugs spending in the U.S. by payer 2010-2024
Prescription drugs spending in the United States from 2010 to 2024, by payer (in billion U.S. dollars)

Savings through generic drug usage in the U.S. 2008-2024
Savings through generic drug usage in the United States from 2008 to 2024 (in billion U.S. dollars)

U.S. brand and generic prescription drug spending 2020-2023
Proportion of branded versus generic prescription drug spending in the United States from 2020 to 2023
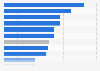
Per capita prescribed medicines spending in high-income countries 2022
Estimated spending on prescription drugs per person in selected high-income nations in 2022 (in U.S. dollars)
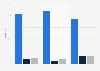
Prescription drug market revenue distribution in the U.S. and the OECD 2022
Distribution of sales of branded and unbranded prescription drugs in the U.S. and OECD countries in 2022
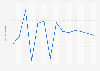
Pharma market growth rate in the United States 2017-2030
Pharma market growth rate in the United States from 2017 to 2030
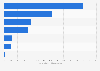
Major drugs losing patent protection worldwide 2025-2030
Major drugs losing patent protection worldwide from 2025 to 2030 (in billion U.S. dollars)
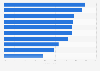
Price reduction of major Medicare expenditure drugs U.S. 2026
Price reduction of major Medicare expenditure drugs in the United States as of January 2026
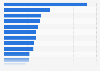
Estimated average growth of major pharmaceutical companies 2026-2030
Estimated average growth of major pharmaceutical companies from 2026 to 2030
Feel free to contact us anytime. We will respond to your inquiry as quickly as possible.


