
Matej Mikulic
Research expert covering health, pharma & medtech
Global pharmaceutical R&D spending has nearly doubled since 2016, reaching around 300 billion U.S. dollars in 2025, and projections point to continued but modest expansion through 2030. Annual spending growth has consistently decelerated, settling at just 1.7 percent in recent years — suggesting the industry has entered a consolidation phase rather than a new investment cycle. The baseline has simply grown large enough that sustaining high growth rates has become structurally harder. Regional dynamics reinforce this shift: China expanded its R&D spending at over 16 percent annually between 2020 and 2024, far outpacing both Europe at around eight and the U.S. at some four percent over the same period. China now accounts for almost one fifth of all companies with active pipelines globally. This divergence points to a structural rebalancing of where pharmaceutical innovation capacity is being built — with implications for long-term competitive positioning between regions.Â
The sheer scale of the global pipeline is striking: the number of drugs in development has grown nearly fourfold since 2001, approaching 23,000 in 2026, supported by over 7,000 companies with active pipelines. This expansion is not arbitrary — oncology, as one of the leading causes of death globally, commands a correspondingly large share of R&D attention. Yet the degree of concentration goes beyond what disease burden alone would explain. Immunological anticancer products account for nearly 4,900 pipeline candidates, more than four times the next-largest therapeutic category, and immuno-oncology compounds represent the leading mechanism of action by a wide margin. This points to a growing structural dependency on a single therapeutic area — one that amplifies the industry's collective exposure to clinical and regulatory setbacks within oncology.
The industry's fundamental challenge is not a lack of ambition but a widening gap between input and output. In 2024, the average clinical trial cycle extended to over 100 months for the first time, up from 93 months four years earlier, while the probability of a drug reaching approval from Phase I remains in the low single digits for oncology — the most heavily funded area. The modality shift toward biologics, gene therapies, and cell-based treatments, while scientifically promising, compounds this dynamic: these approaches carry higher development complexity, longer timelines, and elevated manufacturing demands. Together, these forces point to a structural productivity constraint that spending growth alone cannot overcome.
The tension between expanding pipelines and compressing returns has defined pharmaceutical R&D for much of the past decade, but recent data points to a cautious inflection. The forecast internal rate of return for the top 20 biopharma companies rose to seven percent in 2025 — a second consecutive year of improvement — with the recovery driven largely by GLP-1 and metabolic disease assets advancing into late-stage development. This improvement, however, has been characterized as fragile: progress remains narrowly concentrated in a small number of therapeutic bets rather than reflecting a broad-based productivity recovery across the pipeline.Â
This fragility matters because it mirrors the concentration pattern visible in the pipeline data itself. Investment and dealmaking are increasingly directed toward high-value science and a smaller number of emerging biopharma platforms, suggesting the industry is converging on fewer, higher-conviction programs as a response to the productivity challenge. Whether this represents a sustainable path to improved returns — or simply defers the underlying structural tension — will likely depend on the extent to which next-generation modalities and emerging therapeutic areas can develop into credible new growth engines beyond the current GLP-1 wave.

Detailed statistics
Total global pharmaceutical R&D spending 2016-2030

Detailed statistics
Major 50 pharmaceutical companies - Rx sales and R&D spending 2024

Detailed statistics
Pharmaceuticals: cost of drug development in the U.S. since 1975
Total global pharmaceutical R&D spending 2016-2030
Total global spending on pharmaceutical research and development from 2016 to 2030 (in billion U.S. dollars)

R&D spending growth worldwide on pharmaceuticals 2019-2032
Global growth in total pharmaceutical R&D spending from 2019 to 2032

Growth rate of R&D spending in pharmaceutical industry by major region 2010-2024
Annual growth of pharmaceutical R&D spending in Europe, the U.S., and China between 2010 and 2024
Major 50 pharmaceutical companies - Rx sales and R&D spending 2024
Leading 50 global pharmaceutical companies by prescription sales and R&D spending in 2024 (in billion U.S. dollars)

Pharma companies worldwide with active R&D pipelines 2001-2026
Total number of pharmaceutical companies with active R&D pipelines worldwide from 2001 to 2026

Distribution of pharmaceutical R&D companies by region 2025 vs. 2026
Distribution of pharmaceutical R&D companies worldwide as of 2025 and 2026, by country

R&D spending share of top pharmaceutical companies 2024
R&D spending as revenue share of leading 10 pharmaceutical companies in 2024

Major pharmaceutical companies in R&D spending growth in 2024
Leading 50 pharmaceutical and biotechnology companies worldwide in 2024, by R&D spending growth

Top pharma companies worldwide 2026, by size of R&D pipeline
Leading 15 pharmaceutical companies worldwide by size of R&D pipeline as of 2026

Number of drugs in the R&D pipeline worldwide 2001-2026
Total number of drugs in the R&D pipeline worldwide from 2001 to 2026

Drugs in R&D pipeline worldwide 2025-2026, by phase of development
Number of drugs in the R&D pipeline worldwide as of 2025 vs. 2026, by development phase

Pharmaceutical industry - number of new substances 1998-2025
Number of new chemical or biological entities developed between 1998 and 2025, by region of origin

Projected most valuable R&D projects based on net present value 2026
Leading pharmaceutical R&D projects based on net present value (NPV) as of January 2026 (in billion U.S. dollars)

Top therapeutic categories worldwide 2026, by number of R&D products
Leading 15 therapeutic categories worldwide by number of R&D products as of 2026

Worldwide top diseases 2026, by number of drugs in R&D
Leading 15 diseases worldwide by number of R&D products as of 2026

Worldwide major types for pipeline drugs by number of active drugs 2026
Leading 15 types of drugs in the R&D pipeline worldwide by number of active drugs as of 2026

Worldwide pipeline drugs by delivery route share 2025 vs. 2026
Percentage of drugs in R&D pipeline worldwide by delivery route as of 2025 and 2026

Worldwide top drug-producing mechanisms of action by number of active compounds 2026
Leading 15 mechanisms of action in the R&D pipeline of drugs worldwide by number of active compounds as of 2026

Average length of a clinical trial cycle 2020-2024
Average length of a clinical trial cycle from 2020 to 2024 (in months)

U.S. drug development phase success rates 2011-2020
Probability of success for drugs in the U.S. in different development phases between 2011 and 2020

Clinical trial success rates by therapeutic area 2020
Clinical trial success rates by therapeutic area as of 2020
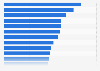
Clinical trial LoA of top pharma companies 2006-2022
Likelihood of approval (LoA) of leading pharmaceutical companies in clinical drug development between 2006 and 2022

Average R&D cost to develop new biopharma compound 2013-2025
Average cost to develop a compound for biopharma companies from 2013 to 2025 (in billion U.S. dollars)

Average peak sales forecast per new biopharmaceutical asset 2013-2025
Projected average peak sales for each new biopharmaceutical asset from 2013 to 2025 (in million U.S. dollars)

Rate of return on biopharma R&D late-stage pipeline 2013-2025
Rate of return on the biopharmaceutical late-stage R&D pipeline from 2013 to 2025

CRO market size worldwide forecast 2032
Global contract research organization (CRO) market in 2022 and a forecast for 2032 (in billion U.S. dollars)

Leading global contract research organizations 2025, based on revenue
Leading global contract research organizations (CROs) 2025, based on revenue (in million U.S. dollars)

CDMO market size worldwide forecast 2025-2034
Contract development and manufacturing organization (CDMO) market size forecast worldwide from 2025 to 2034 (in billion U.S. dollars)

Leading pharma contract development and manufacturing companies 2024
Leading contract development and manufacturing organizations (CDMOs) based on revenue in 2024 (in billion U.S. dollars)

Likelihood of outsourcing drug development activities by biopharma companies 2025
Likelihood of outsourcing select drug development activities in the next 2 years among biopharmaceutical companies worldwide as of 2025

Outsourcing in clinical development among global biopharma companies by size 2025
Percentage of outsourcing models in clinical development among biopharmaceutical companies worldwide as of 2025, by company size
Feel free to contact us anytime. We will respond to your inquiry as quickly as possible.


