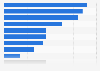
| Characteristic | Participated in 2017 | Will participate in 2018 |
|---|---|---|
| - | - | - |
| - | - | - |
| - | - | - |
| - | - | - |
| - | - | - |
| - | - | - |
| - | - | - |
| - | - | - |
| - | - | - |
| - | - | - |
| - | - | - |
| - | - | - |
| - | - | - |
| - | - | - |
| - | - | - |
| - | - | - |
| - | - | - |
| - | - | - |
| - | - | - |
| - | - | - |
| - | - | - |
The chart is not accessible to screen readers. Please switch to the table view to access the data.
Download
Source
Source
Release date
October 2018
More information
Region
Europe
Survey time period
2017 to 2018
Number of respondents
12,000**
Supplementary notes
* Figures for all countries other than the UK were found by selecting each country location at the top of the source's website and looking at the second infographic on the web page.
** Total number of respondents across 55 countries worldwide, including those not in Europe.
Citation formats