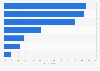
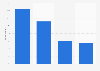


| Characteristic | 2008/09 | 2009/10 | 2010/11 | 2011/12 | 2012/13 | 2013/14 |
|---|---|---|---|---|---|---|
| - | - | - | - | - | - | - |
| - | - | - | - | - | - | - |
| - | - | - | - | - | - | - |
| - | - | - | - | - | - | - |
| - | - | - | - | - | - | - |
| - | - | - | - | - | - | - |
| - | - | - | - | - | - | - |
The chart is not accessible to screen readers. Please switch to the table view to access the data.
Download
Source
Source
Release date
January 2014
More information
Region
United Kingdom
Survey time period
2008 to 2014
Number of respondents
579 respondents
Special properties
households.
Supplementary notes
* Original survey question: "If you could opt for an alternative delivery address / location where would you be likely to choose?"
**Data partially not available.
Citation formats



