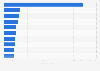
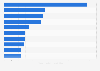
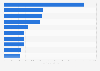
| Characteristic | 2016 | 2017* | 2018* | 2019* |
|---|---|---|---|---|
| - | - | - | - | - |
| - | - | - | - | - |
| - | - | - | - | - |
| - | - | - | - | - |
| - | - | - | - | - |
| - | - | - | - | - |
| - | - | - | - | - |
| - | - | - | - | - |
| - | - | - | - | - |
| - | - | - | - | - |
The chart is not accessible to screen readers. Please switch to the table view to access the data.
Download
Source
Source
Release date
September 2017
More information
Region
United States
Survey time period
2016
Supplementary notes
* Forecast.
Net ad revenue after companies pay traffic aquisition costs (TAC)
Includes advertising that appears on desktop and laptop computers as well as mobile phones, tablets and other internet-connected devices and includes all the various formats of advertising on those platforms.
Numbers may not add up to 100 percent due to rounding.
Figures for 2013 come from a previous publication.
Citation formats