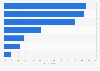
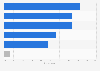


| Characteristic | Number of days |
|---|---|
| - | - |
| - | - |
| - | - |
| - | - |
| - | - |
The chart is not accessible to screen readers. Please switch to the table view to access the data.
Download
Source
Sources
Release date
March 2017
More information
Region
Denmark, Finland, Norway, Sweden
Survey time period
February 2016 to January 2017
Number of respondents
89,223*
Age group
18-79 years
Special properties
12 monthly surveys*
Method of interview
Online panel
Supplementary notes
Original survey question: "Think about your last online purchase. What was your expectations of delivery period, that is how many days did it take for delivery to arrive?" / "T盲nk tillbaka p氓 ditt senaste k枚p av en vara/varor p氓 internet, vilket var dina f枚rv盲ntningar p氓 leveranstiden, dvs. hur m氓nga
dagar det maximalt fick ta att f氓 varan?"
* This statistic shows the results from June survey.
Citation formats





