

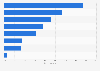


| Characteristic | Share of online shoppers |
|---|---|
| Speed of delivery slower than indicated | 6.47% |
| Website too difficult to use or worked unsatisfactorily | 2.51% |
| Wrong or damaged products delivered | 2.48% |
| Foreign retailer did not sell in my country | 1.61% |
| Problems with fraud | 1.47% |
| Difficulties finding information concerning guarantees, legal rights | 1.32% |
| Final costs higher than indicated | 1.15% |
| Complaints and redress were difficult / no satisfactory response after complaint | 0.63% |
| Other | 2.16% |
| Did not encounter any problems when buying online | 84.94% |
The chart is not accessible to screen readers. Please switch to the table view to access the data.
Loading statistic...
Download
Source
Source
Release date
June 2024
More information
Region
Latvia
Survey time period
2023
Age group
16-74 years
Special properties
purchased online in the past three months
Supplementary notes
Refers to individuals who bought products or services via a website or an app.
The shares do not sum up to 100 percent as several problems could occur at once.
Citation formats



