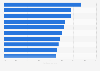
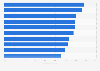
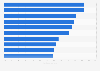
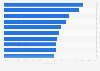
| Characteristic | Number of brands |
|---|---|
| Chocolate | 5.6 |
| Carbonated drinks | 4 |
| Frozen food | 3.7 |
| Breakfast cereals | 3.5 |
| Clothes* | 3.3 |
| Make-up* | 3.3 |
| Beer | 3.3 |
| Cider | 2.9 |
| Skin care* | 2.9 |
| Spirits* | 2.7 |
| Hair care* | 2.4 |
| Shoes & bags* | 2.2 |
| Fragrances* | 2.2 |
| Laundry detergents | 1.9 |
| Tobacco | 1.7 |
| Jewellery & watches* | 1.6 |
| Personal technology* | 1.6 |
The chart is not accessible to screen readers. Please switch to the table view to access the data.
Loading statistic...
Download
Source
Sources
Release date
March 2013
More information
Region
United Kingdom
Survey time period
2012
Number of respondents
3,500**
Special properties
UK shoppers
Supplementary notes
* Average per month, except the following categories that are an average over 12 months: clothes, make-up, skin care, spirits, hair care, shoes & bags, fragrances, jewellery & watches and personal technology.
** Shoppers surveyed by Bain & Company. Data combined with Kantar's real-time purchase tracking of 30,000 UK households. The source states that the shoppers surveyed were representative of the general population and "includied purchasers of all price tears and more than 450 brands in 17 categories, reflecting around 90% of branded FMCG sales".
Citation formats