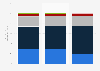
| Characteristic | Share of respondents who were highly or somewhat satisfied |
|---|---|
| - | - |
| - | - |
| - | - |
| - | - |
| - | - |
| - | - |
| - | - |
The chart is not accessible to screen readers. Please switch to the table view to access the data.
Download
Source
Sources
Release date
October 2020
More information
Region
United States
Survey time period
2020
Number of respondents
1,007 respondents
Special properties
the figures represent the percentage of customers who were highly or somewhat satisfied by brand drive-thru experiences; all participants were screened to include those who had at least one drive-thru occasion in the last 30 days
Citation formats