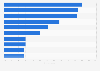
| Characteristic | Purchase Index |
|---|---|
| - | - |
| - | - |
| - | - |
| - | - |
| - | - |
| - | - |
| - | - |
| - | - |
| - | - |
| - | - |
| - | - |
| - | - |
| - | - |
| - | - |
The chart is not accessible to screen readers. Please switch to the table view to access the data.
Download
Source
Source
Release date
April 2013
More information
Region
United States
Survey time period
January 1 to December 29, 2012
Special properties
Hispanic to non-Hispanic white female head of household
Method of interview
Panel survey
Supplementary notes
* Purchase Index: Share of Hispanic dollar sales divided by U.S. household dollar share X 100. The statistic highlights the difference in shopping patterns between Hispanic consumers and total consumers in the United States.
Data stem from the U.S. Nielsen Homescan Panel conducted from January 1 to December 29, 2012.
The original source neither provide information on the number of conducted interviews nor the age of respondents.
Citation formats