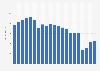
| Characteristic | 2009 | 2010 | 2011 | 2012 | 2013 |
|---|---|---|---|---|---|
| - | - | - | - | - | - |
| - | - | - | - | - | - |
| - | - | - | - | - | - |
| - | - | - | - | - | - |
| - | - | - | - | - | - |
The chart is not accessible to screen readers. Please switch to the table view to access the data.
Download
Source
Source
Release date
September 2013
More information
Region
United Kingdom
Survey time period
June 2013 to July 2013**
Number of respondents
n = 2,517
Age group
16 years and older
Special properties
nationally represenative respondents; respondents were sampled and weighted to reflect UK adult population
Method of interview
Online survey
Supplementary notes
* Respondents were asked to rank advertising formats by impact. The statistic shows the share of respondents who ranked each advertising format among the top three formats with the most impact.
** Dates of most recent survey. Dates of previous surveys were not provided by the source or Deloitte.
Citation formats