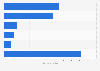
| Characteristic | Women | Men |
|---|---|---|
| Dinner out | 53% | 52% |
| Chocolates | 48% | 54% |
| Candy | 27% | 32% |
| Greeting cards | 24% | 29% |
| Gift cards | 20% | 17% |
| Alcohol/wine | 19% | 18% |
| Personalized gifts | 18% | 27% |
| Home-cooked meals | 8% | 19% |
| Flowers | 17% | 44% |
| Massages | 15% | 28% |
| Jewelry | 15% | 25% |
| Outings | 12% | 6% |
| Perfumes | 10% | 18% |
| Other | 7% | 2% |
| Stuffed toys | 6% | 9% |
| Accessories | 6% | 6% |
| Holidays | 4% | 10% |
| Books | 4% | 7% |
| Photo frame | 4% | 8% |
| Home decor | 3% | 0% |
| Electronic gadgets | 3% | 5% |
| Wearables | 3% | 12% |
| Toiletries | 3% | 1% |
| Cosmetics | 3% | 9% |
| Pets | 2% | 8% |
| Couple's gym membership | 1% | 1% |
| Mixtape | 0% | 2% |
The chart is not accessible to screen readers. Please switch to the table view to access the data.
Loading statistic...
Download
Source
Sources
Release date
January 2020
More information
Region
United States
Survey time period
2020
Number of respondents
2,200 respondents
Age group
18 years and older
Special properties
1,100 male and 1,100 female participants
Method of interview
Online survey
Supplementary notes
Original survey question: "What kind of gifts will you be purchasing for Valentine鈥檚 Day?"
The source did not provide an exact survey date.
Citation formats